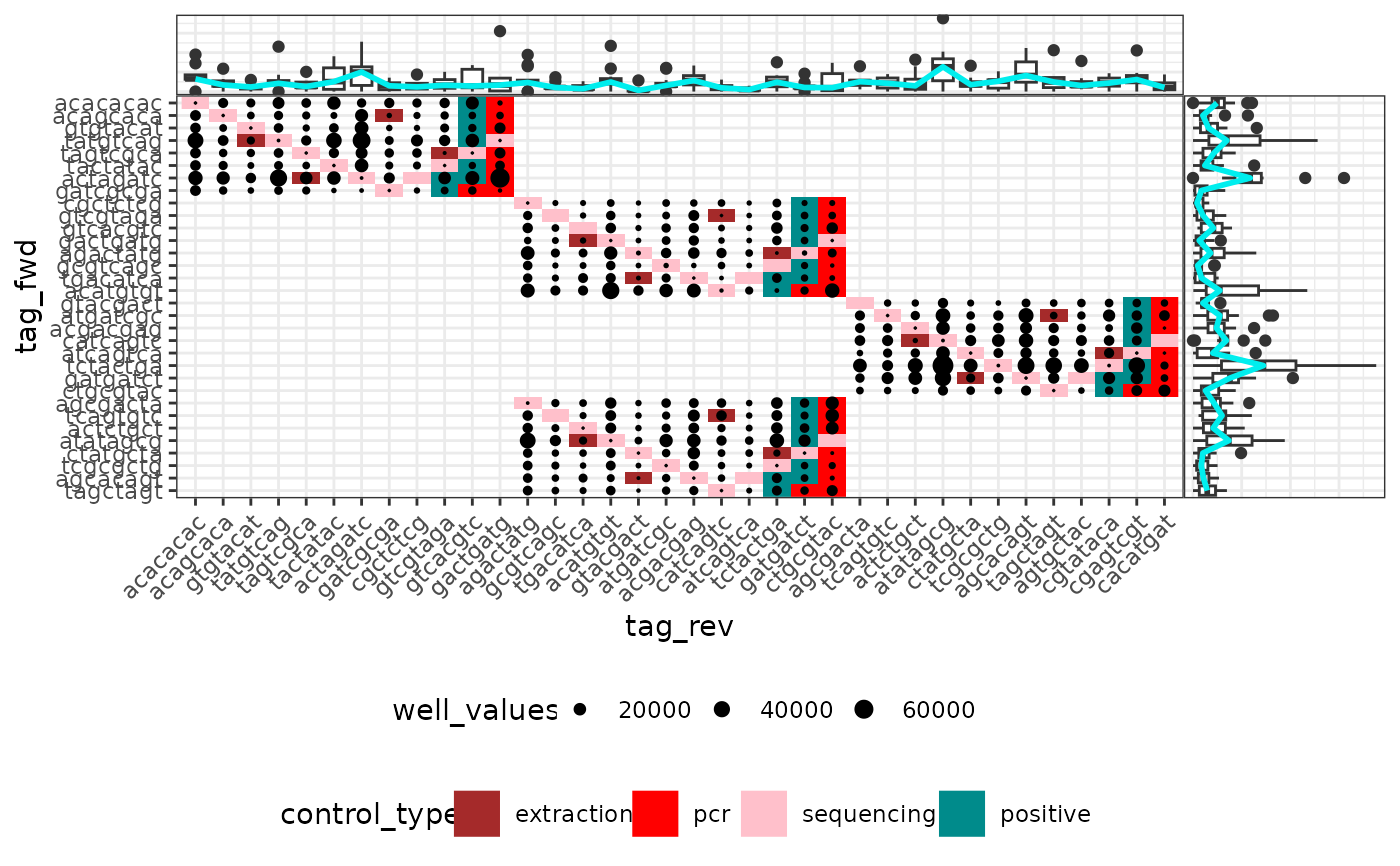
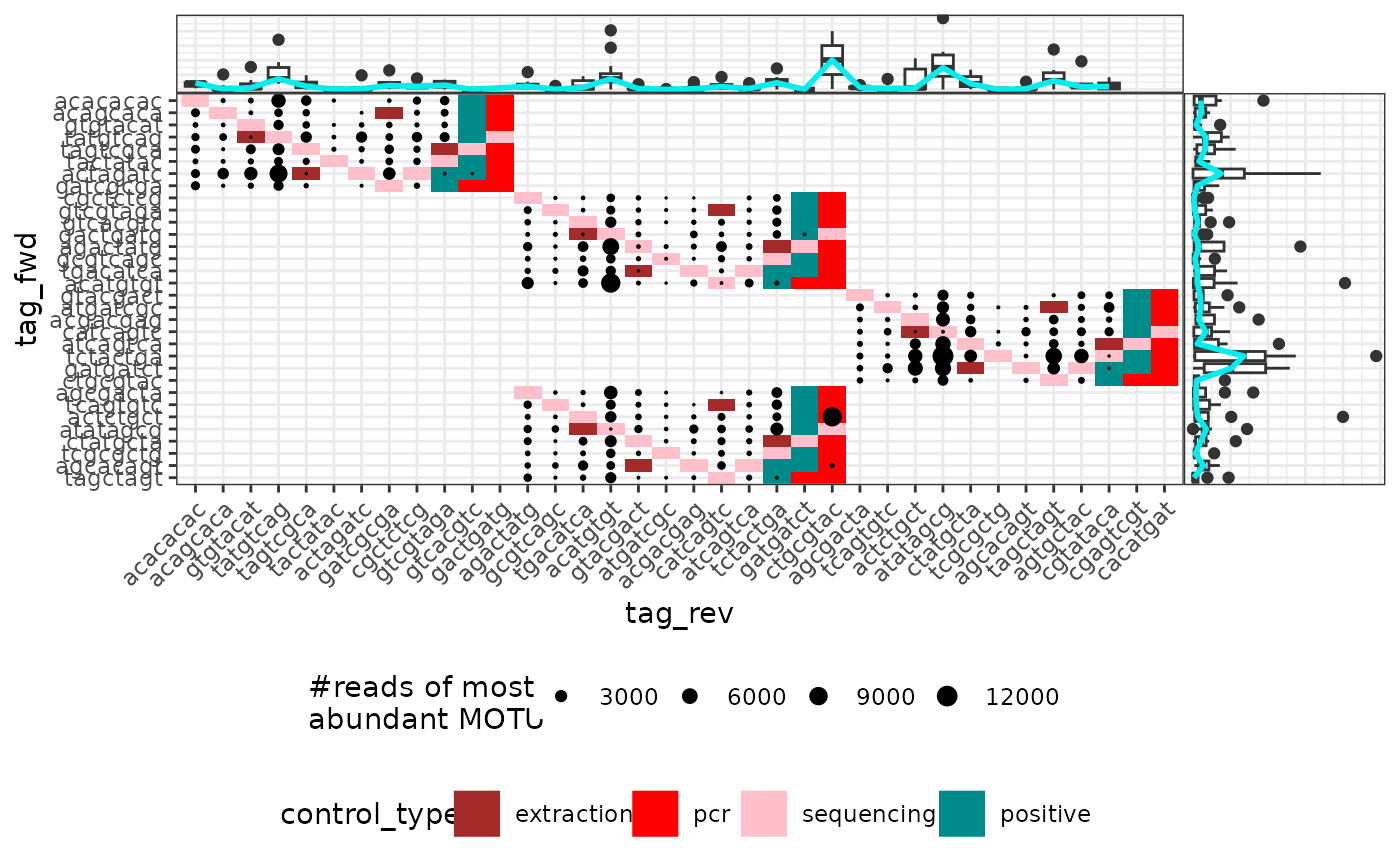
Plots an attribute of PCRs from a metabarlist object in the tag pair design
ggpcrtag(
  metabarlist,
  legend_title = "well_values",
  FUN = function(metabarlist) {
     rowSums(metabarlist$reads)
 },
  taglist = as.character(unique(metabarlist$pcrs$tag_rev))
)
Arguments
- metabarlist
a
metabarlistobject- legend_title
the title of legend containing the plotted information.
- FUN
a function which return a vector containing the information to be plotted. The vector should be a numeric vector which has the same length of table `reads`.
- taglist
a character vector corresponding to the full list of tags ordered as they are used in the PCR plate scheme
Value
a ggplot
Details
Vizualizing attributes of the PCRs in their tag pair design context, i.e. according to the tag combination used. This can be useful to identify potential problems (e.g. low amount of reads due to non-functional primer/tag sets).

