Plots an attribute of PCRs from a metabarlist object into the corresponding 96-well PCR plate design
ggpcrplate(
  metabarlist,
  legend_title = "well_values",
  FUN = function(metabarlist) {
     rowSums(metabarlist$reads)
 }
)
Arguments
- metabarlist
a metabarlist object.
- legend_title
the title of legend containing the plotted information.
- FUN
a function which returns a vector containing the information to be plotted.
The vector should be numeric and of equal length to the number of
rows of the `reads` table.
Details
Visualising PCR attributes in their plate design context, i.e. their location in one or a set of 96-well PCR plates. This can be useful for identifying potential problems (e.g. high amount of reads in one control due to cross contaminations with neighboring samples).
Author
Lucie Zinger, Clément Lionnet
Examples
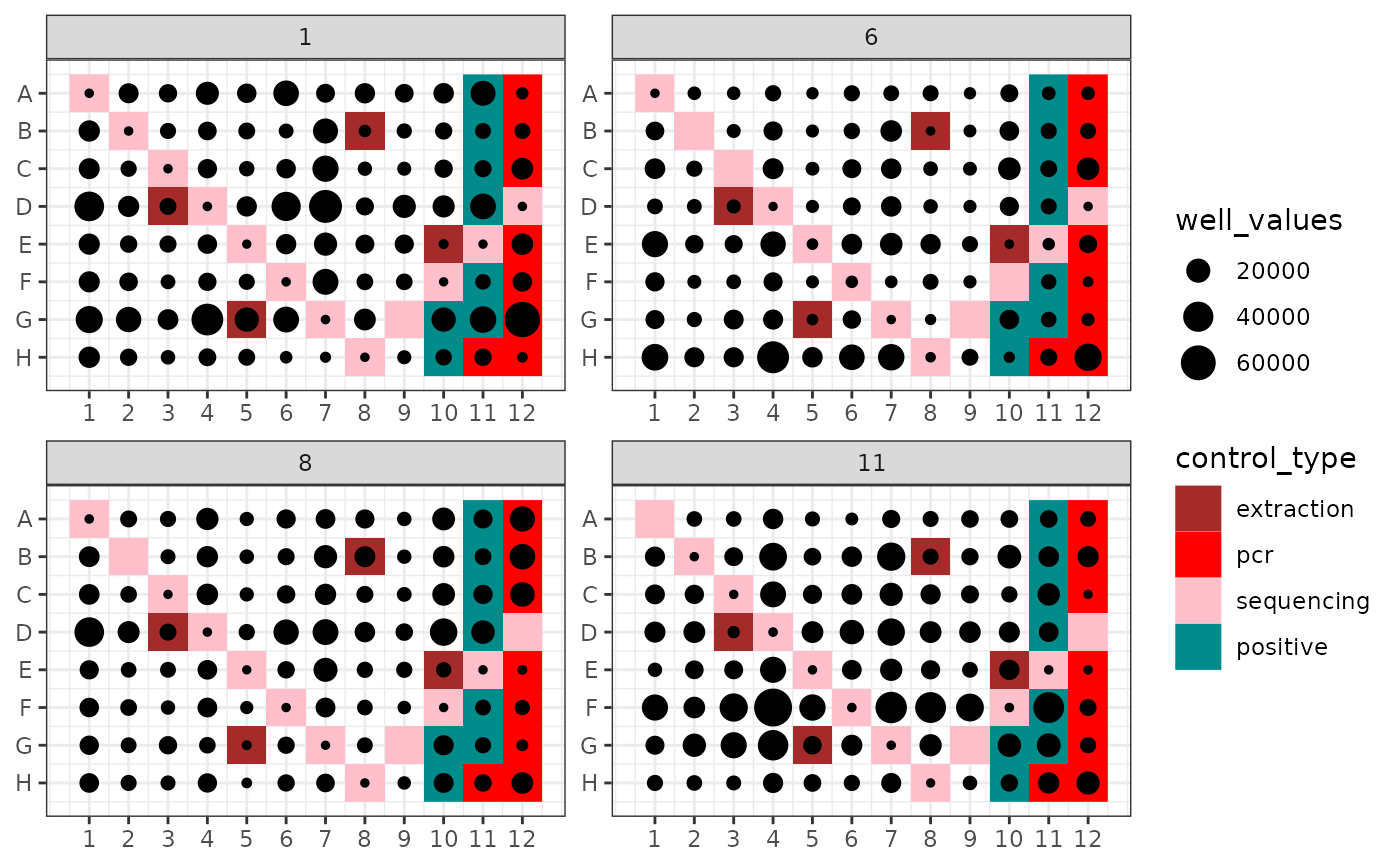
data(soil_euk)
## Plot the number of reads per pcr
ggpcrplate(soil_euk)
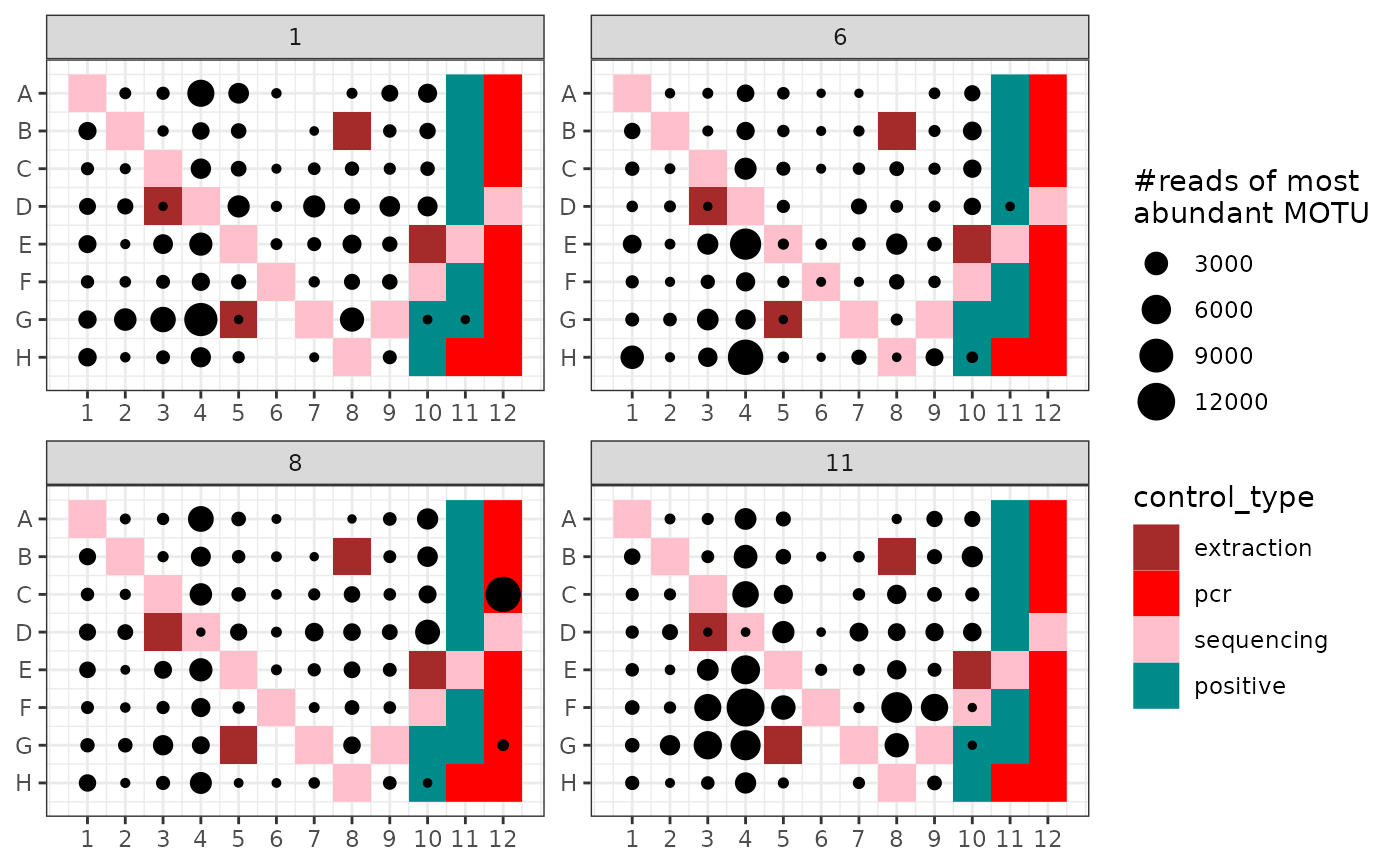
 ## Plot the number of reads of the most abundant MOTU
ggpcrplate(soil_euk,
legend_title = "#reads of most \nabundant MOTU",
FUN = function(m) {
m$reads[, which.max(colSums(m$reads))]
}
)
## Plot the number of reads of the most abundant MOTU
ggpcrplate(soil_euk,
legend_title = "#reads of most \nabundant MOTU",
FUN = function(m) {
m$reads[, which.max(colSums(m$reads))]
}
)