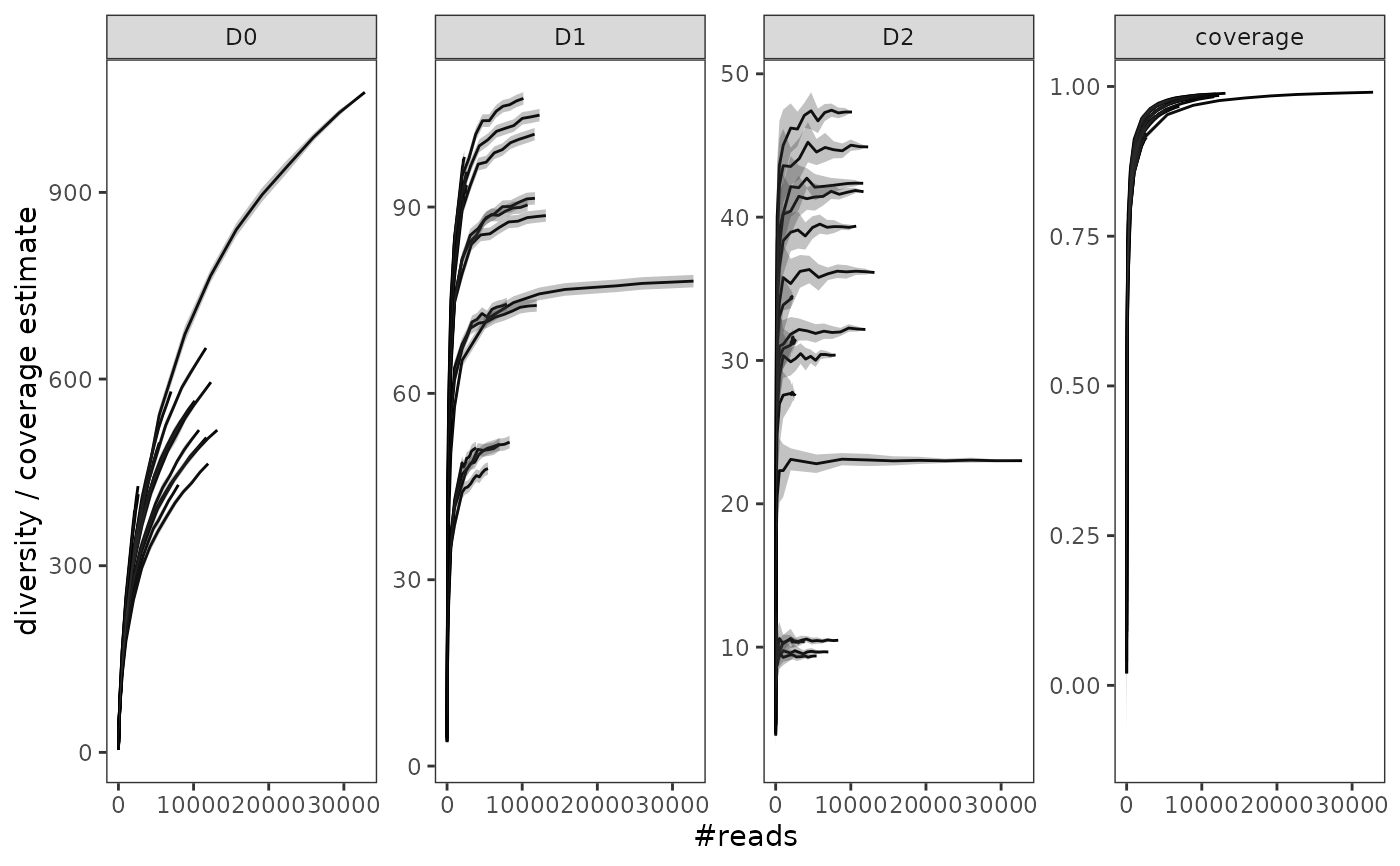
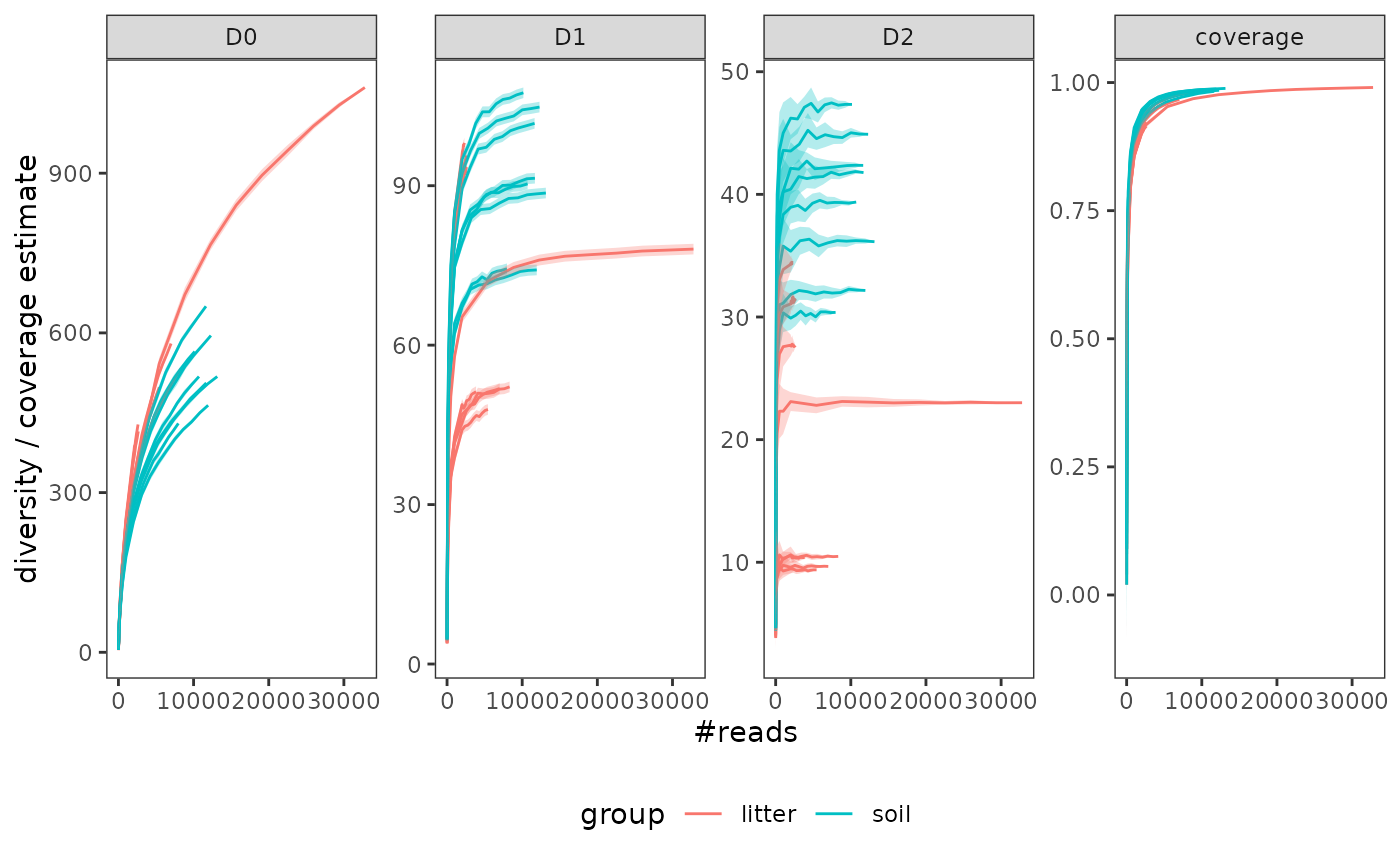
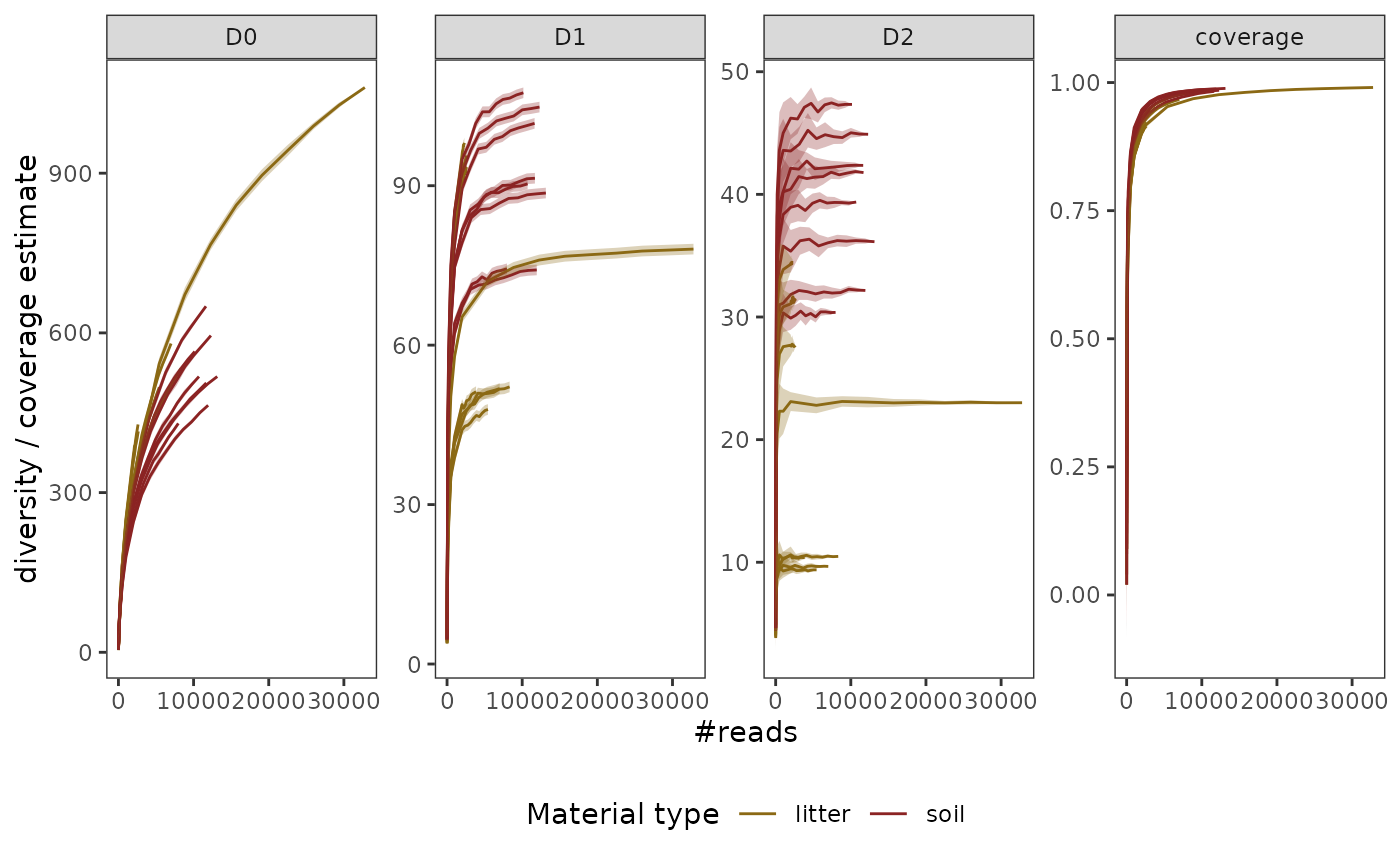
These functions generate and plot rarefaction curves from a metabarlist object using the hill numbers framework (i.e. \(^{q}D\)), as well as Good's coverage index.
hill_rarefaction(metabarlist, nboot = 10, nsteps = 10)

gghill_rarefaction(hill_rar, group = NULL)
Arguments
- metabarlist
a
metabarlistobject- nboot
the number of resampling events to estimate \(^{q}D\) at a given sequencing depth.
- nsteps
the number of steps between sample sizes for the rarefaction curves. Default is 10 steps.
- hill_rar
an object of class
"hill_rarefaction".- group
a vector or factor giving the grouping of each pcr included in the
"hill_rarefaction"object. Missing values will be treated as another group and a warning will be given. The elements should correspond to the pcrs included in the `hill_rar$samples` object. Default is `NULL` for no grouping.
Value
The hill_rarefaction function returns an object of class "hill_rarefaction",
which corresponds to a table of diversity indices for each pcr rarefied at each `nsteps`
sequencing depth, as well as the arguments `nboot` and `nsteps` to conduct the analysis.
Details
hill_rarefaction builds a rarefaction analysis for each PCR of a metabarlist object using Hill numbers for q=0,1,2 (see Chao et al. 2014 for a review). These indices are equivalent to :
Richness, for q=0
Exponential of the Shannon entropy, for q->1
Inverse of the Simpson index, for q=2
The function also returns Good's coverage index (1-singletons/#reads). Note however that this index should be interpreted carefully in metabarcoding data: #'
absolute singletons (across the whole metabarcoding dataset) are usually filtered out during bioinformatic process (which is the case for the
soil_eukdata). The Good's coverage estimate returned here is only based on the number of singletons per PCR after this filtering process, so the true number of singletons is underestimated here.This coverage index gives an assessment of the coverage of the amplicon diversity within a pcr: it includes remaining errors, etc.. The coverage of the genuine DNA fragment diversity in the biological sample is likely to be misestimated with this index.
Functions
hill_rarefaction: Compute hill_rarefaction curves on ametabarlistobject.gghill_rarefaction: Plot a object of class"hill_rarefaction"
References
Chao, A., Chiu, C. H., & Jost, L. (2014). Unifying species diversity, phylogenetic diversity, functional diversity, and related similarity and differentiation measures through Hill numbers. Annual review of ecology, evolution, and systematics, 45, 297-324.
Examples
data(soil_euk)
library(ggplot2)
# Create a subset of pcrs: only a subset of samples from the H20 plot

soil_euk_h20 <- subset_metabarlist(soil_euk,
   table = "pcrs",
   indices = grepl("H20-[A-B]", rownames(soil_euk$pcrs)))

# \donttest{

# run rarefaction (use boot = 20 to limit computation time)
soil_euk_h20.raref <- hill_rarefaction(soil_euk_h20, nboot = 20, nsteps = 10)

# plot the results
gghill_rarefaction(soil_euk_h20.raref)


# plot the results while differenciating litter vs. soil samples
p <- gghill_rarefaction(
         soil_euk_h20.raref,
         group = soil_euk_h20$samples$Material[match(soil_euk_h20$pcrs$sample_id,
                                               rownames(soil_euk_h20$samples))])
#> Warning: The `<scale>` argument of `guides()` cannot be `FALSE`. Use "none" instead as
#> of ggplot2 3.3.4.
#> ℹ The deprecated feature was likely used in the metabaR package.
#>   Please report the issue at
#>   <https://github.com/metabaRfactory/metabaR/issues>.
p

p + scale_fill_manual(values = c("goldenrod4", "brown4", "grey")) +
  scale_color_manual(values = c("goldenrod4", "brown4", "grey")) +
  labs(color = "Material type")


# }
# }