Plots the taxonomic tree from a metabarlist object and maps an attribute onto it
ggtaxplot(metabarlist, taxo, sep.level, sep.info, thresh = NULL)Arguments
- metabarlist
a
metabarlistobject. Should contain taxonomic information in the `motus` table.- taxo
a character string or vector of strings indicating the name of the column (or group of columns) containing the full taxonomic information in the `motus` table from the
metabarlistobject.- sep.level
an optional character string to separate the terms. Required only if `taxo` is a string.
NAnot allowed.- sep.info
an optional character string to separate the terms. Required only if `taxo` is a string.
NAnot allowed.- thresh
a numeric indicating the relative abundance below which taxon labels won't be plotted
Value
a ggplot
Details
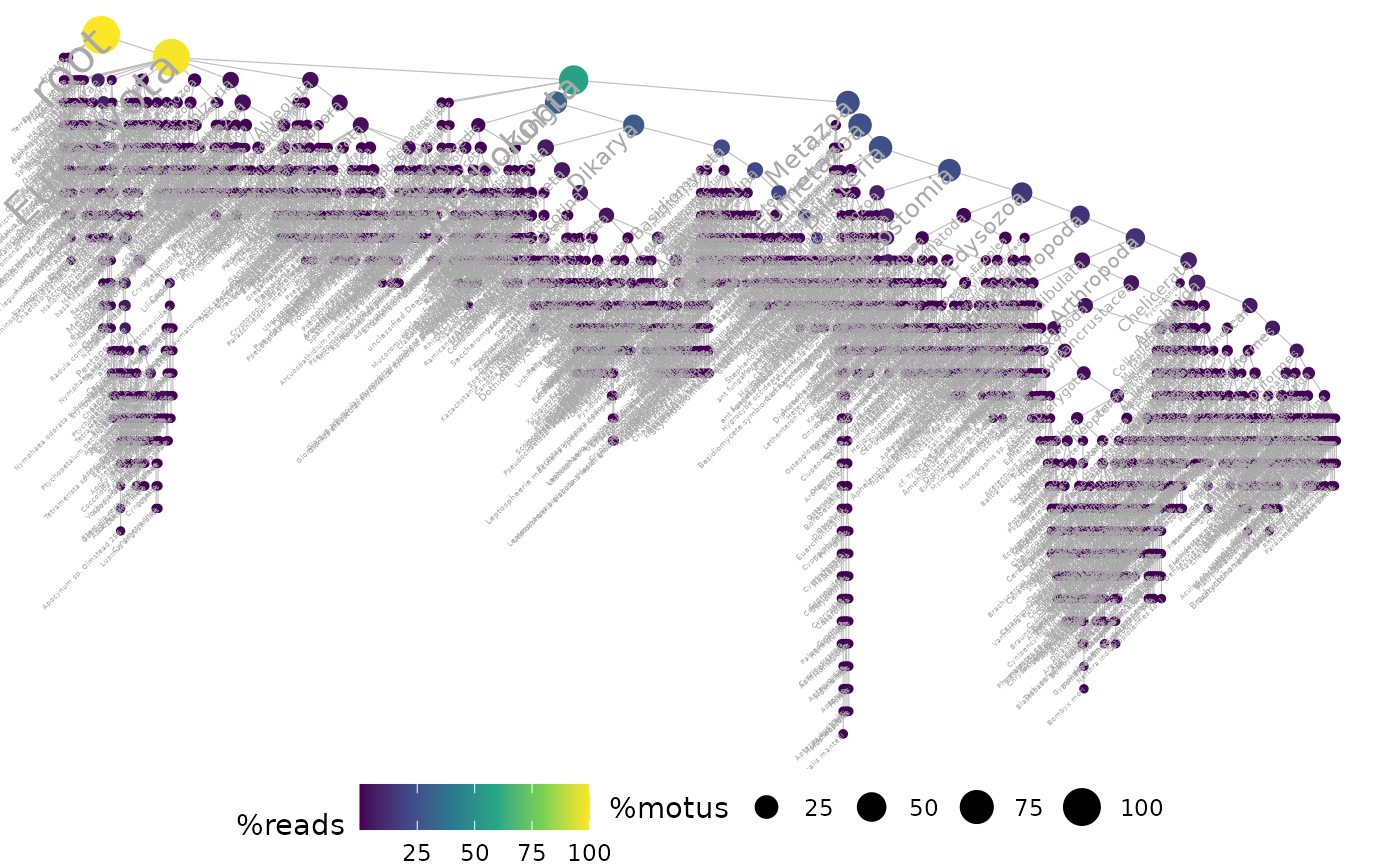
This function allows users to visualise the full taxonomic tree for a set of samples and to map attributes onto the produced tree (e.g. number of reads per node/branches, nb of MOTUs, etc.). The taxonomic information should follow a standard structure across samples (e.g. standard taxonomy as in Genbank, SILVA or BOLD or with defined taxonomic levels if `taxo` is a vector) by decreasing level of taxonomic resolution: the function does not infer missing taxonomic ranks. The taxonomic information should contain a level that is common to all MOTU taxonomic assignments (common ancestor).
See also
Examples
data(soil_euk)
# Using a taxonomic path
# \donttest{
## on all data. can take a while
ggtaxplot(soil_euk, "path", sep.level = ":", sep.info = "@")
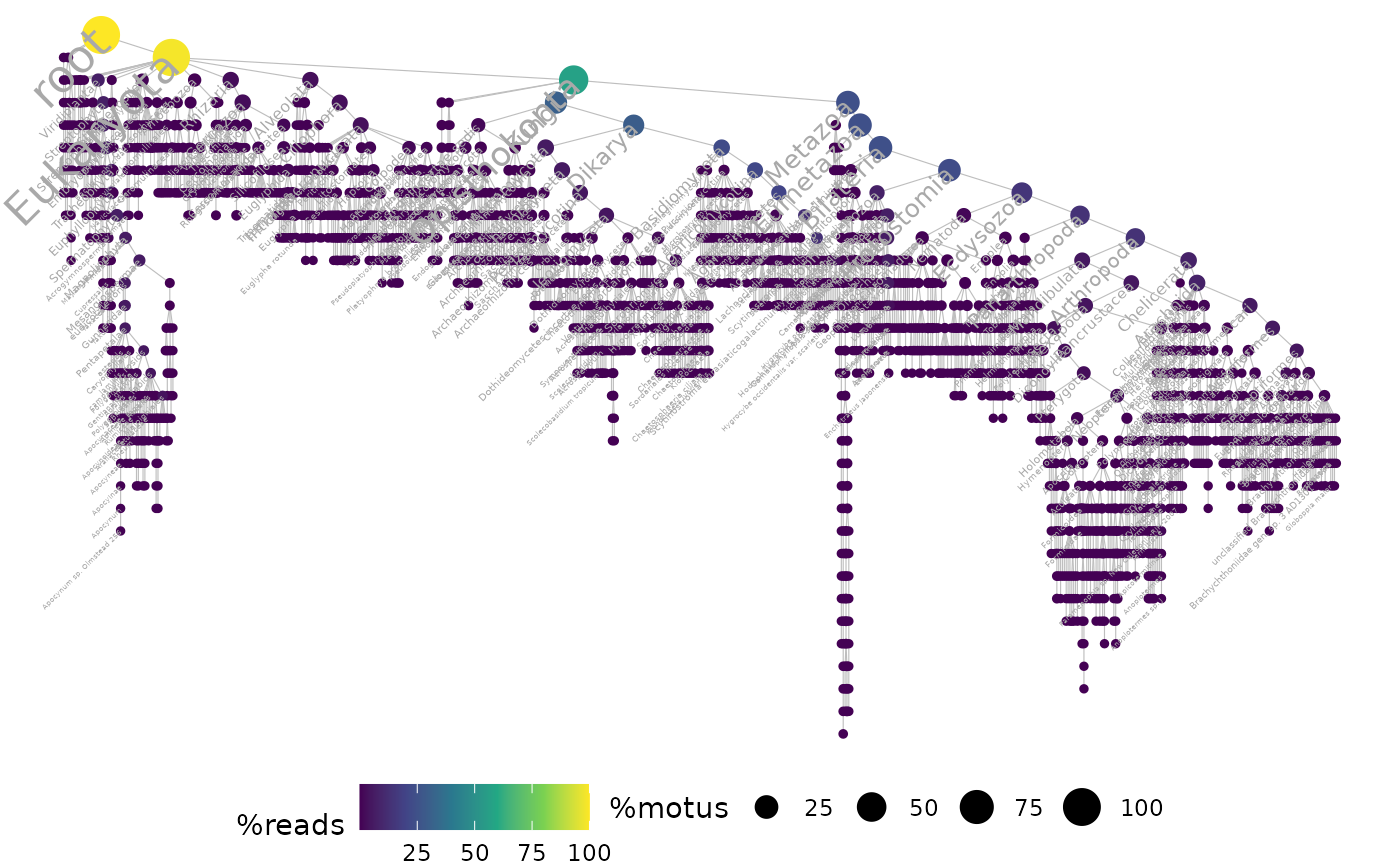
 ## show only taxonomic labels if taxon has a relative abundance > 1e-3
ggtaxplot(soil_euk, "path", sep.level = ":", sep.info = "@", thresh = 1e-3)
## show only taxonomic labels if taxon has a relative abundance > 1e-3
ggtaxplot(soil_euk, "path", sep.level = ":", sep.info = "@", thresh = 1e-3)
 # }
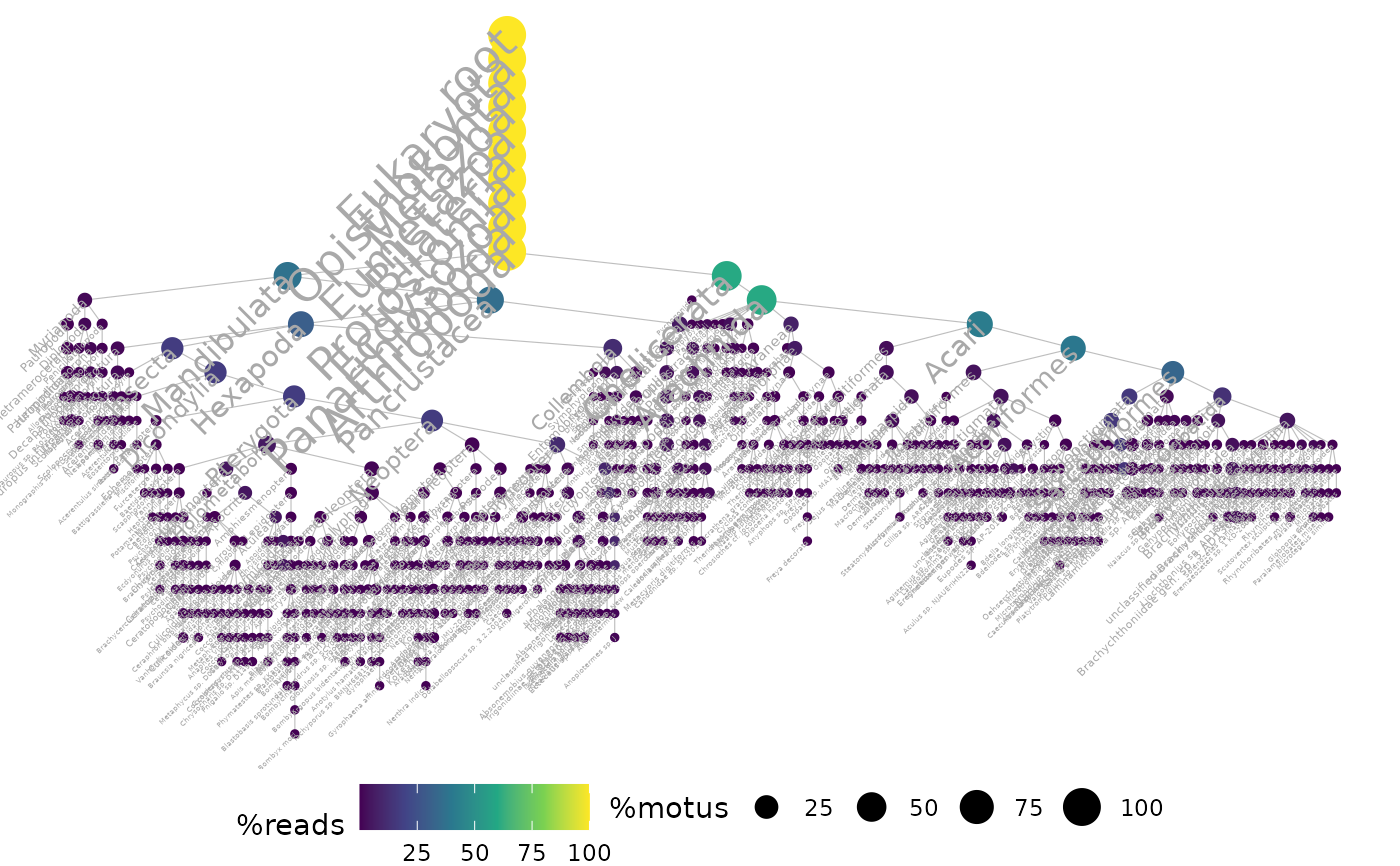
## run on a particular clade e.g. here arthropoda, otherwise difficult to read
arthropoda <- subset_metabarlist(soil_euk,
table = "motus",
indices = grepl("Arthropoda", soil_euk$motus$path)
)
#> Warning: Some PCRs in out have a number of reads of zero in table `reads`!
### plot
ggtaxplot(arthropoda, "path", sep.level = ":", sep.info = "@")
# }
## run on a particular clade e.g. here arthropoda, otherwise difficult to read
arthropoda <- subset_metabarlist(soil_euk,
table = "motus",
indices = grepl("Arthropoda", soil_euk$motus$path)
)
#> Warning: Some PCRs in out have a number of reads of zero in table `reads`!
### plot
ggtaxplot(arthropoda, "path", sep.level = ":", sep.info = "@")
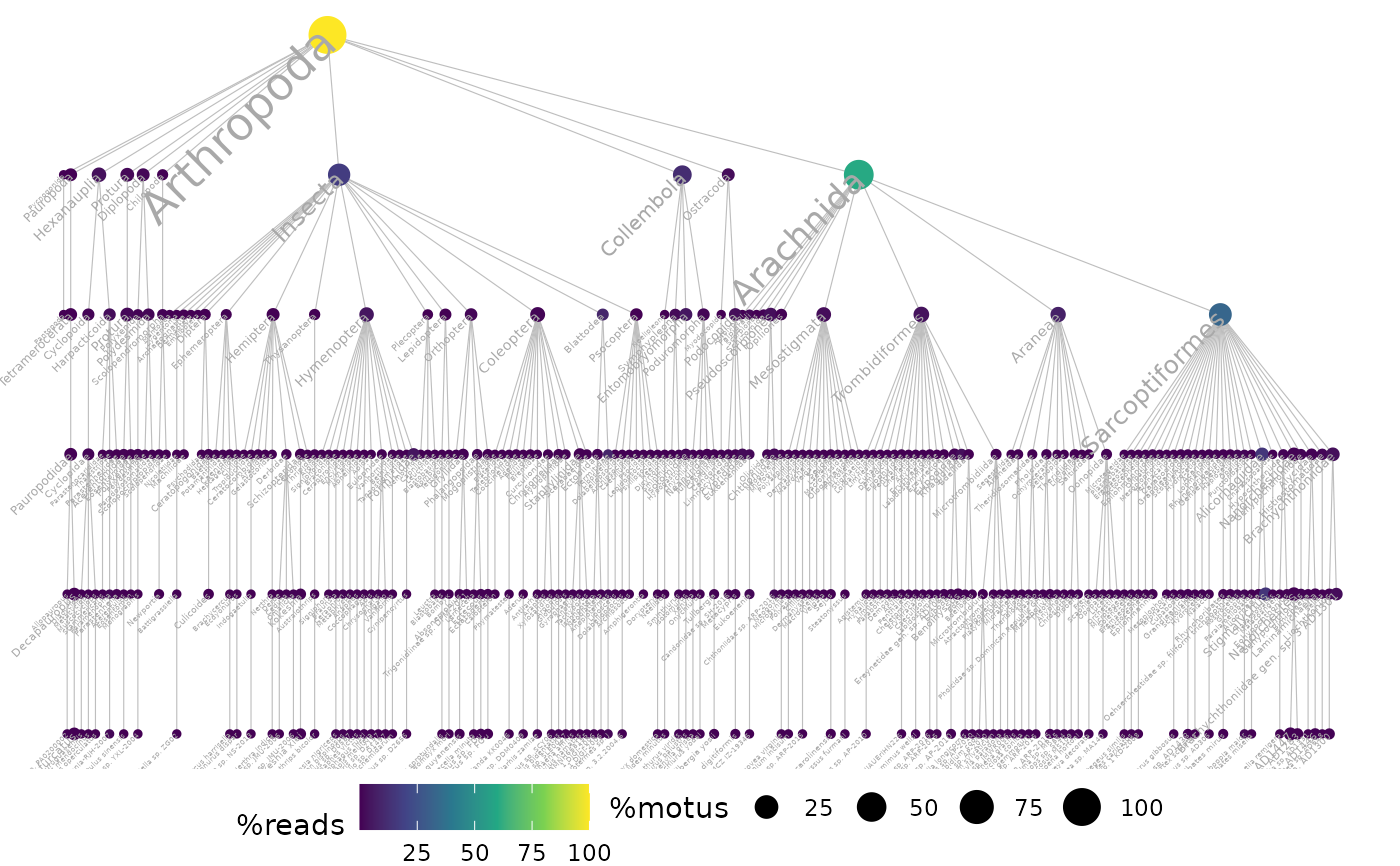
 # Using a taxonomic table
taxo.col <- c(
"phylum_name", "class_name", "order_name",
"family_name", "genus_name", "species_name"
)
ggtaxplot(arthropoda, taxo.col)
# Using a taxonomic table
taxo.col <- c(
"phylum_name", "class_name", "order_name",
"family_name", "genus_name", "species_name"
)
ggtaxplot(arthropoda, taxo.col)
 ## to do the same on the full soil_euk data,
# add a column "kingdom_name" with value "Eukaryota" in soil_euk$motus
## to do the same on the full soil_euk data,
# add a column "kingdom_name" with value "Eukaryota" in soil_euk$motus